Markets
How China Became Saudi Arabia’s Largest Trading Partner
Article/Editing:
Saudi Arabia’s Trade With China Surpasses the West
Over the past two decades, the economic presence of China has been growing significantly around the world.
The country has already surpassed the U.S. as the largest trading partner of developed nations such as Japan and the European Union.
But the world’s second largest economy is making significant inroads in the Middle East as well. This graphic by Ehsan Soltani uses data from the World Trade Organization (WTO) to chart Saudi Arabia’s trading history with the EU, the U.S, and China.
Evolving Trade Relations
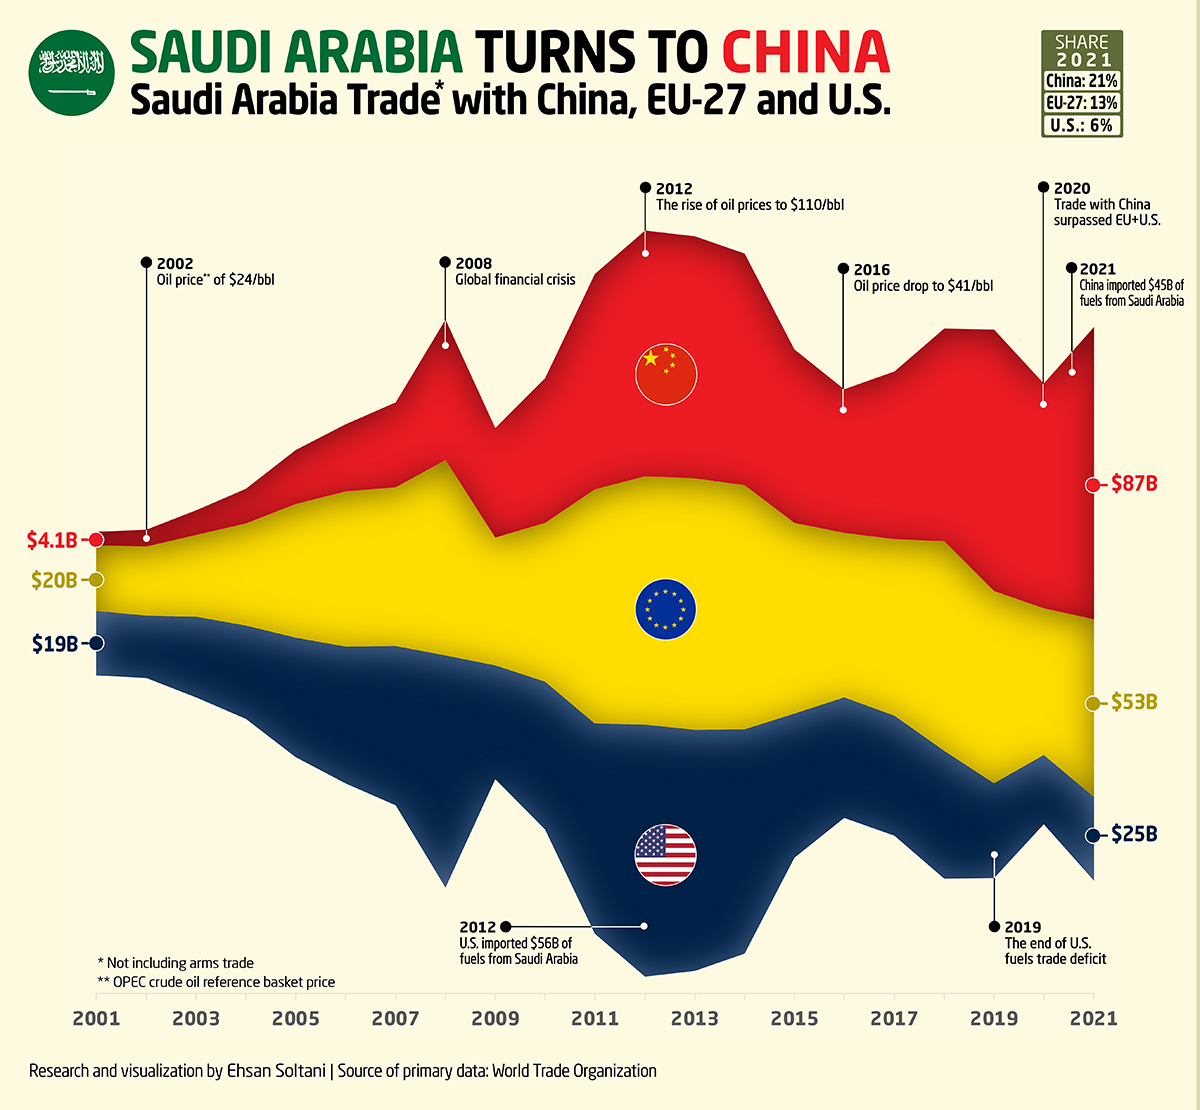
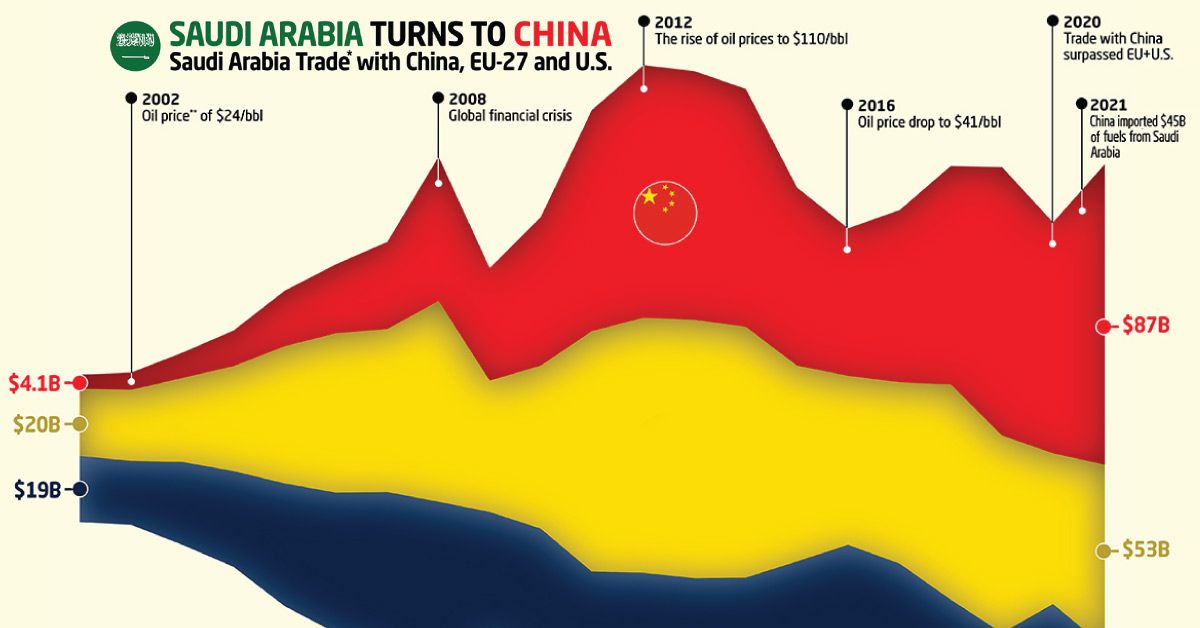
With China’s imports from and exports to Saudi Arabia now exceeding the major oil-producing country’s combined trade with the U.S. and the EU, China has become Saudi Arabia’s dominant trading partner.
| Saudi Arabia Net Trade by Year | With China ($B) | With U.S. ($B) | With EU-27 ($B) |
|---|---|---|---|
| 2021 | $87.3B | $25.1B | $53.1B |
| 2020 | $67.2B | $20.6B | $43.8B |
| 2019 | $78.1B | $28.3B | $57.4B |
| 2018 | $63.5B | $38.2B | $62.7B |
| 2017 | $50.1B | $36.0B | $52.6B |
| 2016 | $42.9B | $36.0B | $49.1B |
| 2015 | $51.8B | $43.2B | $56.9B |
| 2014 | $69.1B | $67.1B | $73.0B |
| 2013 | $72.2B | $72.1B | $75.2B |
| 2012 | $73.3B | $75.3B | $74.3B |
| 2011 | $64.3B | $62.7B | $70.0B |
| 2010 | $43.2B | $44.1B | $47.4B |
| 2009 | $32.6B | $34.0B | $38.2B |
| 2008 | $41.8B | $69.5B | $58.4B |
| 2007 | $25.4B | $47.6B | $47.3B |
| 2006 | $20.1B | $40.9B | $46.2B |
| 2005 | $16.1B | $35.7B | $39.9B |
| 2004 | $10.3B | $27.8B | $30.5B |
| 2003 | $7.3B | $24.1B | $24.4B |
| 2002 | $5.1B | $18.7B | $20.5B |
| 2001 | $4.1B | $19.2B | $19.6B |
Back in 2001, Saudi Arabia’s trade with China was a mere fraction—just one-tenth—of its combined trade with the EU and United States. While the total value of trade was modest at this time, it’s been increasing consistently almost every year since.
By the year 2011, China had surpassed the U.S. for the first time in bilateral trade value with Saudi Arabia. Then by 2018, trade between China and Saudi Arabia surpassed the Middle-Eastern country’s trade with the entire EU.
Fast forward to today, and China has emerged as a larger trading partner with Saudi Arabia than the rest of the West combined.
The Perfect Match?
China’s status as Saudi Arabia’s biggest trading partner makes sense considering its recent economic growth and focus.
China is the largest buyer of crude oil in the world, and it buys more from the Saudi Arabia than anywhere else. Almost half of the $87.3 billion bilateral trade between the two nations in 2021 was comprised of China’s crude oil imports. This accounted for 77% of China’s total imports from Saudi Arabia, which also included goods like plastic—a petroleum product.
Saudi Arabia, meanwhile, imported over $30 billion worth of goods including technological equipment, telephones, and light fixtures.

This article was published as a part of Visual Capitalist's Creator Program, which features data-driven visuals from some of our favorite Creators around the world.


Markets
Visualizing Global Inflation Forecasts (2024-2026)
Here are IMF forecasts for global inflation rates up to 2026, highlighting a slow descent of price pressures amid resilient global growth.


Visualizing Global Inflation Forecasts (2024-2026)
Global inflation rates are gradually descending, but progress has been slow.
Today, the big question is if inflation will decline far enough to trigger easing monetary policy. So far, the Federal Reserve has held rates for nine months amid stronger than expected core inflation, which excludes volatile energy and food prices.
Yet looking further ahead, inflation forecasts from the International Monetary Fund (IMF) suggest that inflation will decline as price pressures ease, but the path of disinflation is not without its unknown risks.
This graphic shows global inflation forecasts, based on data from the April 2024 IMF World Economic Outlook.
Get the Key Insights of the IMF’s World Economic Outlook
Want a visual breakdown of the insights from the IMF’s 2024 World Economic Outlook report?
This visual is part of a special dispatch of the key takeaways exclusively for VC+ members.
Get the full dispatch of charts by signing up to VC+.
The IMF’s Inflation Outlook
Below, we show the IMF’s latest projections for global inflation rates through to 2026:
| Year | Global Inflation Rate (%) | Advanced Economies Inflation Rate (%) | Emerging Market and Developing Economies Inflation Rate (%) |
|---|---|---|---|
| 2019 | 3.5 | 1.4 | 5.1 |
| 2020 | 3.2 | 0.7 | 5.2 |
| 2021 | 4.7 | 3.1 | 5.9 |
| 2022 | 8.7 | 7.3 | 9.8 |
| 2023 | 6.8 | 4.6 | 8.3 |
| 2024 | 5.9 | 2.6 | 8.3 |
| 2025 | 4.5 | 2.0 | 6.2 |
| 2026 | 3.7 | 2.0 | 4.9 |
After hitting a peak of 8.7% in 2022, global inflation is projected to fall to 5.9% in 2024, reflecting promising inflation trends amid resilient global growth.
While inflation has largely declined due to falling energy and goods prices, persistently high services inflation poses challenges to mitigating price pressures. In addition, the IMF highlights the potential risk of an escalating conflict in the Middle East, which could lead to energy price shocks and higher shipping costs.
These developments could negatively affect inflation scenarios and prompt central banks to adopt tighter monetary policies. Overall, by 2026, global inflation is anticipated to decline to 3.7%—still notably above the 2% target set by several major economies.
Adding to this, we can see divergences in the path of inflation between advanced and emerging economies. While affluent nations are forecast to see inflation edge closer to the 2% target by 2026, emerging economies are projected to have inflation rates reach 4.9%—falling closer to their pre-pandemic averages.
Get the Full Analysis of the IMF’s Outlook on VC+
This visual is part of an exclusive special dispatch for VC+ members which breaks down the key takeaways from the IMF’s 2024 World Economic Outlook.
For the full set of charts and analysis, sign up for VC+.

-

 United States6 days ago
Visualizing the Most Common Pets in the U.S.
-

 Culture2 weeks ago
The Highest Earning Athletes in Seven Professional Sports
-

 Science2 weeks ago
Visualizing the Average Lifespans of Mammals
-

 Brands2 weeks ago
How Tech Logos Have Evolved Over Time
-

 Energy2 weeks ago
Ranked: The Top 10 EV Battery Manufacturers in 2023
-

 Countries2 weeks ago
Countries With the Largest Happiness Gains Since 2010
-

 Economy2 weeks ago
VC+: Get Our Key Takeaways From the IMF’s World Economic Outlook
-

 Demographics1 week ago
The Countries That Have Become Sadder Since 2010