Process Net-Map is a version of Net-Map that focuses on mapping the consecutive steps of a process rather than the (more static) network connections between actors. It is especially useful for
- understanding the nitty-gritty of implementation processes,
- visualizing how the actual process might differ from formally prescribed procedures,
- where a process suffers due to concentration of power or overlapping responsibilities,
- and whether and where there are structural entry points for corruption and leakage.
Process Net-Map has been developed in collaboration with Regina Birner with input from Jennifer Hauck at UFZ and from other colleagues at IFPRI.
How to use Process Net-Map?
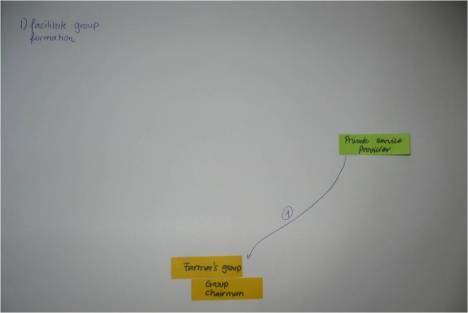
Step 1: Ask interview partner to describe the process step-by-step.
Every time a new actor is mentioned, write the actor name on a card and put it on the map. Each step in the process is indicated by a link between actors. The link is numbered and a legend on the map describes the meaning of each number.
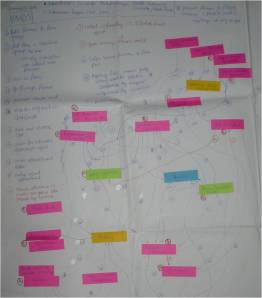
This procedure is continued until the final step in the implementation process is reached. This may be the distribution of inputs to the beneficiaries in a public procurement program, or the redeeming of the vouchers in a voucher-based program. The finished map can be rather complex (see picture 2).
Step 2: Setting up influence towers:
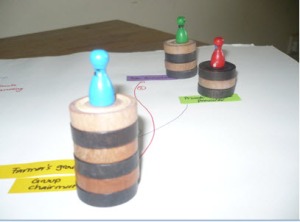
Interviewees are asked how influential different actors are in achieving the final goal of the process. Influence towers (made of checkers pieces and actor figurines) are set up next to the actor cards.
While doing this, the respondents are asked to explain why the respective actors have the assigned level of influence.
Step 3: Identify possible implementation hurdles:
The respondents are asked to identify where in the implementation process possible problems may occur. In this phase, the interviewers might emphasize that it is not the goal to identify problems that may have occurred in the study location, but rather to identify potential entry points for problems. To avoid conflicts of interest, the respondents are explicitly encouraged to consider problems they have observed in other locations rather than their own. The problem spots are marked on the map by drawing symbols or circles next to them, numbering them and adding explanations to the legend. In this step, you mostly identify specific actor positions, links or a combination of links that pose a structural problem. A typical example would be one actor who is involved in giving out contracts, giving out payment and quality control.
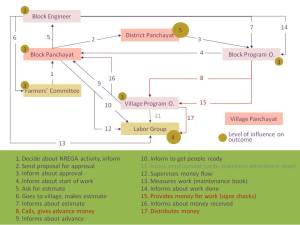
Step 4: Digitalizing the process map
We found that the best way to computerize the map is by drawing flow charts in Powerpoint (using text boxes and connectors). This allows to present the results in a way that reflects the step-by-step mapping approach used during the interview and allows the audience to follow its logic and main points without being overwhelmed (unfortunately, as long as paper doesn’t react to mouse-clicks, the print version of the map cannot take the reader on the same journey).
Click here to see how this Process Net-Map evolved step-by-step.
(Source:
Raabe, K., Birner, R., Sekher, M., Gayathridevi, K. G., Shilpi, A., & Schiffer, E. (2010, forthcoming).
How to Overcome the Governance Challenges of Implementing India’s National Rural Employment Guarantee Scheme – Insights from Bihar Using Process-Influence-Mapping. Washington, DC: Discussion Paper; International Food Policy Research Institute.
Benefits of Process Mapping:
- The process narrative of the data collection mirrors the natural flow of a conversation (“First we do this, then that, etc.”), which makes it easy for both respondents and interviewers to use the format.
- Mapping / visualizing the process allows to see all consecutive steps at the same time. This helps to identify structural issues that would not be apparent by looking at steps one after the other.
- Focusing on structure makes it easier to talk about sensitive issues (corruption / leakage) in a less personalized way. For project planners and implementers eliminating structural incentives for corruption is crucial. Respondents tend to point at specific links or actor positions to locate where the problem is located.
- “The devil is in the detail.” And: “The best plan is only as effective as its implementation.” Process Net-Map helps opening up the black box of implementation.
This process is continued until the final step in the implementation process is reached. This may be the distribution of inputs to the beneficiaries in a public procurement program, or the redeeming of the vouchers in a voucher-based program.


[…] Process Net-Map […]
Hi Eva
I think this is a really good idea. A healthy alternative to more abstract Gantt charts and the like
Did you / or would it be useful to break the process down into temporal stages, like every three months? Otherwise the number of relationships created could grow very large, because you may be interacting with different people every day.
Visualyser can do animations, which you could use to show different stages in the process.You can color code links by attribute and attributes can include stages. You can also use attribute values to capture the relative influence of the actors. When you hold the cursor over links and nodes it makes those attributes visible.
Re Step 3: Identify possible implementation hurdles: The respondents are asked to identify where in the implementation process possible problems may occur.
Did you get people to think of problem locations in terms of which relationships, or was the question posed in more general terms?
I looked for the flow chart option in Powerpoint but could not find it. Where is it?
regards, rick
Dear Rick,
Thanks for the fast and very helpful comments. As you will see, I have changed the entry already to make some of the points more clear.
In ppt you can draw boxes and connectors (arrows that can only be attaced to four specific points of the box), voila, flow chart.
That is one of the reasons why I’m more and more leaning towards using ppt instead of SNA programs: If we are serious about saying: This is for everyone and we want to transfer ownership of the process, it makes sense to use a program that everyone basically has already and where you don’t have to learn something as abstract as square matrixes to enter the data.
Plus, I so often deal with embedded actors (let’s say 5 people who sit on one committee) and it’s easy in ppt to draw a circle around the actors and have some links go to them directly and others to the circle. But I’ll look into the animation function of Visualyzer. Sounds interesting…
Temporal breakdown: That could make sense if you go to a specific level of detail or the project is very complex. At the moment the cases were structured in a way that it was one unit. For example: What happens from the approval to the actual implementation and payment of work in a public works program in India. This is not about “Who did you talk to today” but what is the process (can be formal or informal) that needs to be followed to get from A to B. In this case it would make sense to cut it up not in terms of time slots but it might make sense to have different parts of the activity in different maps. From decision making to start of work. From start of work to finish. From finish to payment. However, in this specific case only by having the whole cycle in one map, the concentration of power in few hands (someone decides about who does it, gives out the money and does quality control) became apparent…
Talking about hurdles: That’s the most amazing part and happened by mistake the first time. Our interviewers wanted to set up influence towers but got lost in translation and the respondents thought the question was: “Who is most corrupt in this network?” To everyone’s surprise they answered this without much hesitation and it was rather straightforward for them to describe what links provide incentives for corruption. If you clicked on the link for the slide show you saw certain areas where a combination of links leads to bad incentives. What this also does is to say: Most wrong behavior is not because of evil individuals but of structural issues – go fix the structure instead of wasting so much time running after thieves.
Cheers
Eva
Hi Eva,
Thanks for this! I feel like you were reading my mind 😉
I like the idea that you add actors as they’re needed/mentioned at each step!
Some questions for you:
What do you do when one step invovles lots of actors without a clear direction to the step? (For instance, Alive and Thrive holds planning meeting with x, y, and z departments in the Ministry of Health .)
In the process map, do links have to have a direction?
Do they have to be one-to-one?
Is a planning meeting really significant enough to be a step in the process? (That is, how do you determine what is its own step?)
thanks!
Noora
Hi Noora,
Thanks for these very thought provoking questions. I discussed them with Regina Birner over lunch today. There are a number of options how you could visualize your meeting. If you have a group of people that tends to hold regular meetings (let’s say a committee that comes together regularly for different steps in the implementation) you could draw a circle around all the members and instead of drawing links between all of them that are numberrd, you just write the number in the circle and write the explanation in the legend as if it was the number of a link. However, Regina said that sometimes (especially if it is just a one-off meeting) chose a different color/shape post-it to signify that this is not an actor but an event and put the meeting on a card on the map. Then all actors who attend would have arrows directed at this meeting card, all with the same number.
The links tend to have directions and that reflects the direction in which the action flows over time. And often there are more than two actors involved so it’s not necessarily a one-to-one link but it is important that all links that describe one step get the same number.
Whether a planning meeting is a step or not… Well, the answer to this might be different in different cases. It depends on the level of detail with which you analyze the process. And whether the meeting is seen as significant step by your interview partners. You know how, in traditional Net-Map, we sometimes discuss whether to group actors or to put them on the map separately (i.e. have one tag “NGOs” or have three with the names of three different NGOs). The answer there is: If they act as separate actors with different links, goals, influence levels, treat them as separate actors, if they act as very similar, group them. I think that the question of whether something is a step or not can be approached in a similar way – add it if it seems significant. Even though “significant” does not necessarily mean “very important for the process”. Sometimes I would also include steps that people don’t find “very important” because it might also help to understand whether there are steps that look so important on paper but have little relevance in reality…
I hope this makes sense…
Cheers
Eva
Coming from a Lean Six Sigma background, I am very familiar with the concept of process mapping. However, the step that I’ve been missing is adding the this influence of actors, which traditionally, I’d use a stakeholder management tool, but never really felt right.
Great Step forward – hope it catches on.
Thanks Leroy,
I think that especially if you want to understand the dynamics with the how and why it is crucial to talk about influence / power. That’s when normally the most interesting discussions happen…
Cheers
Eva
Which are the anti-corruption tools a humanitarian worker has to know?…
For me the most important thing you have to understand about corruption is that most of the times it is the system and not the amoral individual that leads to corruption. I sometimes joke that there are corrupt chairs in some systems. Whoever sits down…
[…] Process Net-Map « Net-Map Toolbox. Like this:LikeBe the first to like […]